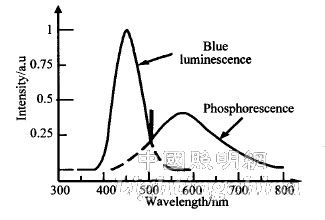
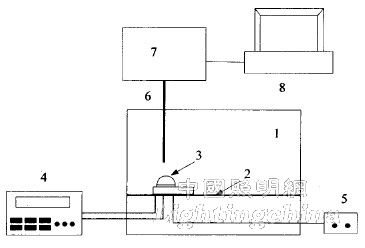
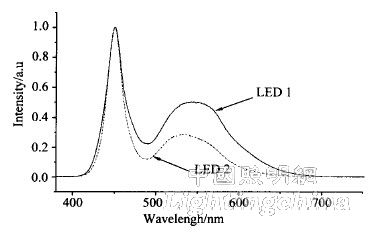
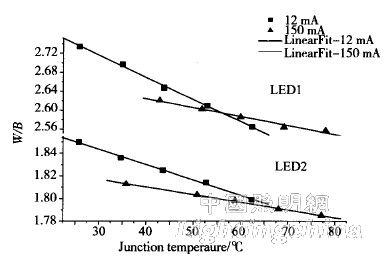
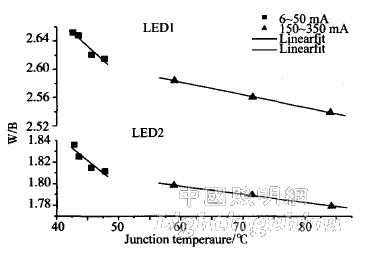
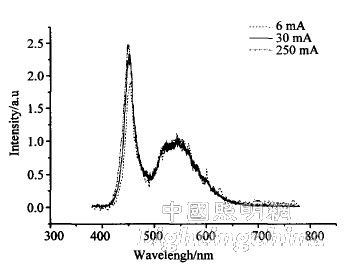
0 Preface As a new type of light source, light-emitting diodes (LEDs) have the characteristics of small size, high efficiency, long life, environmental protection and energy saving. Since the beginning of the world, they have attracted worldwide attention. Especially in recent years, the rapid development of high-power white LEDs is expected to replace incandescent lamps and fluorescent lamps, making them the ideal solid-state illumination source for the next generation. PN junction temperature is one of the important parameters of high-power LED, which directly affects the LED light-emitting efficiency, device reliability and device lifetime. LED junction temperature control is a key factor in the preparation of high-power LED chips, device packaging and device applications. Therefore, the measurement of LED junction temperature has become one of the hotspots of engineering and applied theory research. The combination of blue chip external phosphor coating is one of the common methods for producing high-power white LEDs. For the measurement of the junction temperature of such high-power white LEDs, in addition to the commonly used infrared camera measurement methods and electrical parameter measurement methods, MJ Narendran et al. proposed a new method, a spectroscopy method, which uses the ratio R of the white and blue components in the LED spectrum to determine the junction temperature. It is a non-contact measurement method that does not damage the overall structure of the LED and does not damage the working state of the LED. It is an ideal method for testing the junction temperature. In this paper, different types of 1W high-power white LEDs are studied. The current magnitude and ambient temperature are changed. The relationship between the junction temperature and the spectrum of white LEDs is studied. It is found that different types of white LEDs have white light spectral integral and blue light spectral integral. There is a linear relationship between the ratio W/B and the junction temperature, but the linear relationship is different. The effects of current and ambient temperature on this linear relationship are not exactly the same. For the same LED, the linear relationship is different for different current regions, and the absolute value of the slope of the relationship corresponding to the small current region is large. Obviously these differences have reference value for determining the junction temperature by using the blue-to-white ratio of LED spectrum. 1 Principles and methods The LED volt-ampere characteristics meet the ordinary diode equation and can be written as Where If is the forward current, Vf is the forward voltage, Io is the reverse saturation current, n is the theoretical factor, k is the Boltzmann constant, and T is the temperature. In general, Where Rs is the internal resistance of the LED caused by ohmic contact. It can be seen from equation (2) that at constant current, the junction temperature of the LED is linear with the forward voltage drop. This linear relationship can be expressed as Where Vi is the voltage across the LED when the initial temperature is To, Vf is the voltage across the LED when the temperature is Tp, and K is the voltage temperature coefficient. When the current is small, the LED thermal effect is small, and the temperature is automatically adjusted by the incubator to keep the ambient temperature constant. The LED junction temperature is approximately equal to the pin temperature at the moment of energization. Measuring the voltage value of the same small current at several known temperatures is linearly fitted by equation (3) to obtain a voltage temperature coefficient K. In practice, a small current is generally selected at the inflection point of the volt-ampere characteristic curve of the LED. This will ensure that the LED is just turned on and there is no obvious LED thermal effect. For a finished LED, the heat sink and structure are fixed, and the thermal resistance coefficient of the PN junction to the environment is certain. The LED junction temperature and pin temperature satisfy the following relationship: Where Tj and Tp are junction temperature and pin temperature, respectively, Rθj-p is the thermal resistance coefficient, and P heat is the LED thermal power. If the luminous efficiency of the LED is η, then P heat = P(1 - η). The power P is equal to the product of the input current IH and the forward voltage drop VH. LED thermal resistance coefficient can be measured by forward voltage drop method After obtaining the thermal resistance coefficient, the junction temperature of the LED can be obtained by the formula (4). Figure 1 is a typical spectrum of a white LED produced by a combination of a blue chip externally coated phosphor. In order to obtain the spectral integral ratio of blue light and white light, blue light must be separated from white light. As shown in Fig. 1, after subtracting the background spectrum, the blue spectrum integral B is obtained by integrating the spectrum on the left side of the vertical line, and the entire spectrum curve is integrated to obtain the white light spectrum integral W. Figure 1 white LED spectrum curve 2 Experiments and results The experimental light path is shown in Figure 2: the fixed LED is placed on the bracket in the incubator (constant temperature fluctuation ≤ 1 oC); the thermocouple measures the LED pin temperature, and the other thermocouple measures and feeds back the temperature of the incubator, according to the feedback situation. Adjust the incubator to keep the temperature inside the incubator at the desired value. The constant current source provides a steady current to the LED and displays the voltage and current indications. One end of the cable is fixed on the three-dimensional frame, and the light emitted by the LED is coupled into the light guiding cable (the transmittance in the visible light band) by adjusting the three-dimensional frame, and the other end is connected to the fluorescence photometer (Hitachi F4500, the spectral resolution is 0.2). Nm). A computer controlled fluorophotometer tests the spectrum and stores and processes the data. This experiment was carried out in a dark room. The specific measurement process is as follows: (1) Set the temperature of the incubator for 2h. After the system is stable, measure the spectral background data. Turn on the constant current power supply, output small current (6 mA, 12 mA, 30 mA, 50 mA). After 15~20 min, after the LED status is stable, record the voltage Vi across the LED, the LED pin temperature Tp and Spectral distribution SPD. (2) Adjust the constant current power supply, output high current IH (150 mA, 250 mA, 350 mA is selected), and continuously energize for 15-20 min. After the system reaches thermal equilibrium, record the voltage VH and pin of the LED respectively. Temperature Tp and LED spectral distribution SPD. Turn off the constant current power supply and measure the background spectrum immediately. Because the LED junction temperature drops rapidly after the power is turned off, the local environment in the incubator will change if not measured immediately. Figure 2 Schematic diagram of the experimental device 1. Thermostat 2. Bracket 3. White LED 4. Constant current power supply 5. Thermocouple 6. Optical cable 7. Fluorescence photometer 8. Computer (3) The large current IH is restored. After it is stabilized, the large current IH is quickly replaced by the small current IM, and the voltage value Vf at this time is quickly recorded. (4) Adjust the temperature of the incubator (25°C, 35°C, 45°C, 55°C, 65°C), and measure the spectrum and other parameters at other ambient temperatures according to the same procedure. The voltage across the LED at each temperature is substituted into the formula (3), and the linear fitting is performed by the least squares method. The voltage temperature coefficients K of the warm white LED1 and the cool white LED 2 are respectively 2.06 mV/°C and 1.87 mv/°C. The calculated voltage temperature coefficient K and the measured voltage and current equivalent values ​​are fitted to the formula (4) to obtain the thermal resistance coefficients Rθj of LED1 and LED2 are 32.02 ° C / W and 30.29 ° C / W, respectively. Figure 3 shows the normalized luminescence spectra of LED1 and LED2 at the same current and temperature. It can be seen from Figure 3 that the blue peaks of the two tubes agree well, but the center wavelength of the yellow peak is different. The intensity is also different, due to the different levels of phosphors. The warm white tube (LED1) has a strong yellow light, and the ratio of blue to white is also large. The color temperature of the warm white tube is 3 000 K; the yellow light of the cool white tube (LED 2) is weak, and the color temperature is 6800K. Figure 3: Normalized luminescence spectra of two LED tubes Substituting the thermal resistance coefficient into the formula (4), the junction temperature Tj in each state is obtained, and the white light spectral integral W and the blue light spectral integral B are calculated by the method described above, and their ratio R is obtained. Taking the junction temperature Tj as the abscissa and the blue-white ratio R as the ordinate, draw the relationship between the two LED tubes R and the junction temperature. It can be seen from Fig. 4 that the ambient temperature rises, causing the junction temperature of the LED to rise. The blue-white ratio W/B of different currents is linear with the junction temperature Tj, but the slope of the linear relationship of different LEDs is different. It can be seen from Fig. 5 that the increase in current causes the junction temperature of the LED to rise, and the blue-white ratio W/B is linear with the junction temperature Tj. However, for different types of LEDs, the slope is not the same, which is derived from the different amounts of phosphors of different LED tubes, and is one of the characteristic properties of white LEDs. Both the increase in current and the increase in ambient temperature will cause an increase in junction temperature, but they contribute differently to the linear relationship between blue-to-white ratio and junction temperature. For example, the slope of LED2 in Figure 4 is 6.77×10⁻⁴. The slope of LED2 in Figure 5 is 7.51 × 10⁻⁴ with slight differences. It can also be seen from FIGS. 4 and 5 that the relationship between the blue-white ratio and the junction temperature corresponding to the small current region has a relatively large absolute slope. Fig. 4 Relationship between W/B and junction temperature of two LED tubes when the ambient temperature is constant Fig. 5 Relationship between W/B and junction temperature of two LED tubes when the operating current is constant (T=45°C) Figure 6 is a spectrum of the current of 6 mA, 30 mA, 250 mA at a temperature of T = 65 ° C, set the peak of all spectral yellow light to 1, observe the blue peak, and find the blue peak and peak with the current Decreasing and decreasing, the wavelength of the blue peak is also red-shifted, and the peak wavelengths are 449.6 nm, 451.8 nm, and 454.4 nm, respectively. The half-height widths of the blue peaks are 17.4 nm, 21.2 am, and 23 nm, respectively, which increase with increasing current. There are similar rules for other currents and temperatures. At a small current, the peak value of the blue light decreases, and the full width at half maximum decreases, meaning that the intensity of the blue light becomes low, and the effective excitation efficiency of the phosphor also becomes low. Therefore, the decrease in the blue-white ratio of the spectrum caused by the increase in junction temperature has a more serious effect on the small current, and the decrease is faster, and the absolute value of the slope is also larger. In addition, there is an overheating effect of a small current in the PN junction, that is, the smaller the measured current, the larger the ratio of the current density in the high temperature region to the low temperature region, and the more concentrated the current is in the high temperature region, thereby generating more Joule heat to the high temperature region. The temperature is higher. Especially in the case of small current, this effect is more obvious, and the junction temperature cannot be evenly distributed, which is easy to cause measurement error. The small current is generally selected at the inflection point of the volt-ampere characteristic curve, which is much smaller than the normal operating current and rated current. The error caused by this effect is not negligible, and the slopes of the small current and the large current are also inconsistent. Generally, the working current and rated current of the LED tube are far away from the instantaneous conduction current of the LED tube, that is, generally working in the large current region described in the text, by measuring the spectrum of the white LED of the current region to obtain the relationship between the junction temperature and the spectrum, Get the junction temperature of the LED quickly. Figure 6. Normalized spectrum of different currents at the same temperature 3 Summary In this paper, two different types of high-power white LEDs were taken as the research object. The junction temperature and spectrum of the LED were measured, and the linear relationship between the ratio of the white light spectrum integral and the blue light spectrum integral B and the junction temperature was obtained. Different types of white LEDs have different relationships; the increase in junction temperature caused by current and the rise in ambient temperature have some differences in the contribution of this linear relationship. For the same LED, the slope of this linear relationship is not the same in different current regions. In practice, the blue-white method should be used to measure the junction temperature of white LEDs. Further theoretical and experimental research will reveal the law and mechanism of the relationship between the spectrum and the junction temperature of LED under different working currents, and provide a basis for the correct use of LED. Edit: Cedar Babbitt Wire is with tin as the base, the product is added with certain amount of antimony, copper
or other improved elements.
Sn Sb7Cu3 Babbit metal is suitable for metal spraying on the end face of metalized ï¬lm capacitor. With strong adhesive force, good weldability and low loss angle, it is an ideal metal spraying material for laminated capacitor.
Other trade marks are suitable to use CMT, TIG and MIG technology to manufacture sliding bearing bush material layer. It is of high bonding strength with substrate, with material utilization rate of 70~80%. It has small amount of ingredient segregation without any loose or slag inclusion. The internal control standard of the alloy composition is prevailing over GB/T8740-2013. Babbi1 metal added with improved elements can substantially enhance the service life.
Snsbcu Babbitt Wire,Overlaying Materials,Thermal Spray Babbitt Wire,Babbitt Wire Shaoxing Tianlong Tin Materials Co.,Ltd. , https://www.tianlongspray.com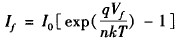 (1)
(1)  The "one-1" item in parentheses in (1) can be ignored, taking into account the pressure drop caused by ohmic contact. (1) can be written as
 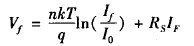 (2)
(2) 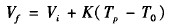 (3)
(3)  (4)
(4) 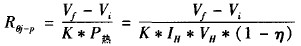 (5)
(5)