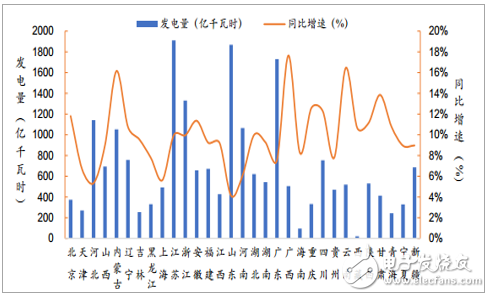
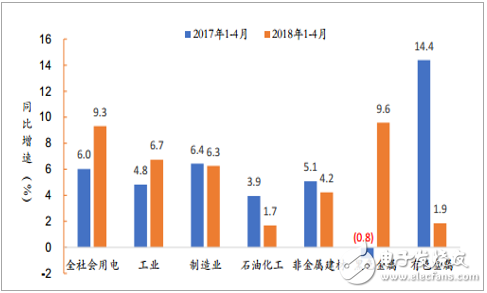
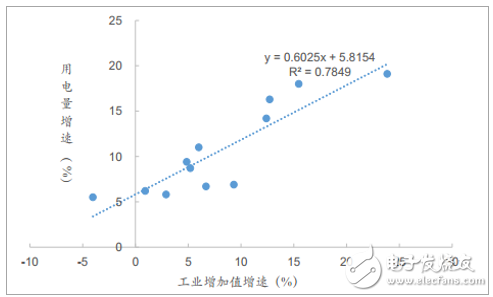
In the first four months of 2018, the total electricity consumption of the whole society was 2,199.4 billion kWh, a year-on-year increase of 9.3%. Among them, the national total electricity consumption in April was 521.7 billion kWh, a year-on-year increase of 7.8%, a record increase since 2012. Speed ​​new high. The growth of electricity consumption in the whole society started well, mainly due to factors such as stable macroeconomic stability, continuous replacement of electric energy, and low temperature in the first quarter. The secondary industry contributed the most to the increase in electricity consumption in the whole society. In the first four months of 2018, the total electricity consumption of the whole society increased by 9.3% year-on-year, maintaining a relatively high growth rate since the first quarter of 2018. After splitting the growth rate of electricity consumption in the whole society by industry, the growth rate of 9.3 percentage points contributed 4.8 percentage points to the secondary production, accounting for more than 50%, and the tertiary industry and residential electricity consumption contributed 2.2 and 2.2 percentage points respectively. Electricity consumption in April increased by 7.8% year-on-year, of which the contribution of secondary production was 5.1%, and that of tertiary industry and residential electricity contributed 1.6 and 1.0 percentage points respectively. In the first four months of 2018, the contribution of the whole society's electricity consumption increased the split generator Source of data: public information Split contribution contribution of the whole society's electricity consumption growth in April 2018 Source of data: public information In terms of provinces, in April 2018, the top three in terms of electricity consumption were Guangdong (48.9 billion kWh), Shandong (47.5 billion kWh), and Jiangsu (46.3 billion kWh). Electricity consumption increased by more than 12%. There are 5 provinces: Guangxi (19.0%), Yunnan (14.9%), Inner Mongolia (14.2%), Fujian (13.4%), and Tibet (12.5%). Electricity consumption and year-on-year growth in the provinces from January to April 2018 Source of data: public information In April 2018, industrial production continued to be stable and good in the first quarter of 2018. The added value of industrial enterprises above designated size increased by 7.0% year-on-year, of which the industrial added value of manufacturing industry increased by 7.1%. Under the supply-side reform, the backward production capacity has withdrawn and the supply and demand situation of industrial products has improved. Among the output of major industrial products, the output of crude steel, steel and ten non-ferrous metals increased by 5.0%, 5.0% and 2.3% respectively, and the output of integrated circuits increased by 13.6%. Electricity consumption in the automotive industry increased by 8.1% year-on-year, and electricity consumption in the computer, communications and other electronic equipment manufacturing industries increased by 12.6% year-on-year. Among the four high-energy-consuming industries, the growth rate of power consumption of petrochemicals and non-ferrous metals has fallen sharply. The growth rate of electricity consumption of ferrous and non-ferrous metals in the four high-energy industries has declined. Source of data: public information In the year of 2018, the growth rate of electricity consumption is improving. From the historical data analysis, the correlation between the growth rate of electricity consumption in January and April and the growth rate of industrial added value is strong. The decision of the growth rate of the two in the past 10 years The coefficient R2 is 0.78. Electricity consumption growth rate and industrial added value growth rate in January-April Source of data: public information
UPS
True Doulbe-vonversion
microprecessor control optimizes reliability
wide input range
LCD Display On/Offline Ups,Online Double Conversion Ups,Online And Offline Ups,Online Ups System zhejiang ttn electric co.,ltd , https://www.ttnpower.com